Batangas is a province located in the Calabarzon region of the Philippines. It is situated on the southern shores of Luzon Island, and is bordered by the provinces of Cavite and Laguna to the north, Quezon to the east, and the Mindoro Strait to the south. Batangas is known for its beautiful beaches, historical landmarks, and culinary delights. In this article, we will delve into the demographics, real estate developments, economy, culture, and other related information about Batangas.
Demographics
According to the 2015 Census data for Batangas, here’s a summary of the demographic information you provided:
- Age Groups and Populations:
- The age group with the highest population in Batangas was individuals aged 5 to 9, totaling 267,393 individuals.
- The age group with the lowest population was those aged 80 and over, which included 24,609 individuals.
- Age Group Aggregates:
- When grouping age categories:
- Those aged 14 and below, including infants, babies, children, and young adolescents/teenagers, constituted approximately 29.82% of the total population, amounting to 803,396 individuals.
- The age group of 15 to 64, representing the economically active population and potential workforce, made up a significant 64.97% of the population, totaling 1,750,563 individuals.
- The old dependent population, consisting of senior citizens aged 65 and over, accounted for 5.21% of the total population, equivalent to 140,376 individuals.
- When grouping age categories:
- Age Dependency Ratios:
- The calculated Age Dependency Ratios provide insights into the population’s dependency on different age groups:
- For every 100 individuals in the working age population, there were 46 youth dependents (aged 14 and below) and 8 aged/senior citizens (aged 65 and over).
- In total, there were 54 dependents (combining young and old-age) for every 100 of the working population.
- The calculated Age Dependency Ratios provide insights into the population’s dependency on different age groups:
- Median Age:
- The median age of Batangas in 2015 was 25 years. This statistic indicates that half of the population was younger than 25, while the other half was older than 25. It provides an essential measure of the age distribution within the province.
These statistics offer a comprehensive overview of the age distribution and dependency ratios in Batangas as of 2015. Please keep in mind that demographic data can change over time due to various factors, such as birth rates, migration, and aging populations, so more recent data may reveal different patterns.
| Name | City/ Municipality | Population (2020) | Population (2015) | Annual Population Growth Rate (2015‑2020) | Area (km2) | Density (2020), per km2 | Brgy count |
|---|---|---|---|---|---|---|---|
| Agoncillo | municipality | 39,101 | 38,059 | 0.57% | 49.96 | 783 | 21 |
| Alitagtag | municipality | 26,819 | 25,300 | 1.24% | 24.76 | 1,083 | 19 |
| Balayan | municipality | 95,913 | 90,699 | 1.18% | 108.73 | 882 | 48 |
| Balete | municipality | 24,055 | 22,661 | 1.26% | 25.00 | 962 | 13 |
| Batangas City | city (CC), capital | 351,437 | 329,874 | 1.34% | 282.96 | 1,242 | 105 |
| Bauan | municipality | 90,819 | 91,297 | -0.11% | 53.31 | 1,704 | 40 |
| Calaca | municipality | 87,361 | 81,859 | 1.38% | 114.58 | 762 | 40 |
| Calatagan | municipality | 58,719 | 56,449 | 0.83% | 101.50 | 579 | 25 |
| Cuenca | municipality | 36,235 | 32,783 | 2.13% | 58.18 | 623 | 21 |
| Ibaan | municipality | 58,507 | 52,970 | 2.12% | 68.99 | 848 | 26 |
| Laurel | municipality | 43,210 | 39,444 | 1.94% | 71.29 | 606 | 21 |
| Lemery | municipality | 93,186 | 93,157 | 0.01% | 109.80 | 849 | 46 |
| Lian | municipality | 56,280 | 52,660 | 1.41% | 76.80 | 733 | 19 |
| Lipa | city (CC) | 372,931 | 332,386 | 2.45% | 209.40 | 1,781 | 72 |
| Lobo | municipality | 40,736 | 41,504 | -0.39% | 175.03 | 233 | 26 |
| Mabini | municipality | 50,858 | 46,211 | 2.04% | 44.47 | 1,144 | 34 |
| Malvar | municipality | 64,379 | 56,270 | 2.87% | 33.00 | 1,951 | 15 |
| Mataasnakahoy | municipality | 30,621 | 29,187 | 1.01% | 19.66 | 1,558 | 16 |
| Nasugbu | municipality | 136,524 | 134,113 | 0.38% | 278.51 | 490 | 42 |
| Padre Garcia | municipality | 51,853 | 48,302 | 1.50% | 41.51 | 1,249 | 18 |
| Rosario | municipality | 128,352 | 116,764 | 2.01% | 226.88 | 566 | 48 |
| San Jose | municipality | 79,868 | 76,971 | 0.78% | 53.29 | 1,499 | 33 |
| San Juan | municipality | 114,068 | 108,585 | 1.04% | 273.40 | 417 | 42 |
| San Luis | municipality | 36,172 | 33,149 | 1.85% | 42.56 | 850 | 26 |
| San Nicolas | municipality | 23,908 | 22,623 | 1.17% | 22.61 | 1,057 | 18 |
| San Pascual | municipality | 69,009 | 65,424 | 1.13% | 50.70 | 1,361 | 29 |
| Santa Teresita | municipality | 21,559 | 21,127 | 0.43% | 16.30 | 1,323 | 17 |
| Santo Tomas | city (CC) | 218,500 | 179,844 | 4.18% | 95.41 | 2,290 | 30 |
| Taal | municipality | 61,460 | 56,327 | 1.85% | 29.76 | 2,065 | 42 |
| Talisay | municipality | 46,238 | 45,301 | 0.43% | 28.20 | 1,640 | 21 |
| Tanauan | city (CC) | 193,936 | 173,366 | 2.39% | 107.16 | 1,810 | 48 |
| Taysan | municipality | 40,146 | 38,007 | 1.16% | 93.62 | 429 | 20 |
| Tingloy | municipality | 19,215 | 17,919 | 1.48% | 33.07 | 581 | 15 |
| Tuy | municipality | 46,519 | 43,743 | 1.30% | 94.65 | 491 | 22 |
| Batangas Total | 2,908,494 | 2,694,335 | 1.62% | 3,115.05 | 934 | 1,078 | |
Economy
| Fiscal Year | Annual Regular Income | Change |
|---|---|---|
| 2009 | 1,589,421,017.91 | – |
| 2010 | 1,849,139,581.03 | 16.34% |
| 2011 | 1,857,489,628.29 | 0.45% |
| 2012 | 1,869,371,231.98 | 0.64% |
| 2013 | 2,036,193,008.84 | 8.92% |
| 2014 | 2,278,894,519.55 | 11.92% |
| 2015 | 2,506,252,764.03 | 9.98% |
| 2016 | 2,737,354,928.79 | 9.22% |
| End notes:Annual Regular Income = Locally Sourced Revenue + Internal Revenue Allotment (IRA) Current Year + Other Shares from National Tax CollectionLocally Sourced Revenue = Real Property Tax (General Fund) + Tax on Business + Other Taxes + Regulatory Fees + Service/User Charges + Receipts from Economic Enterprises | ||
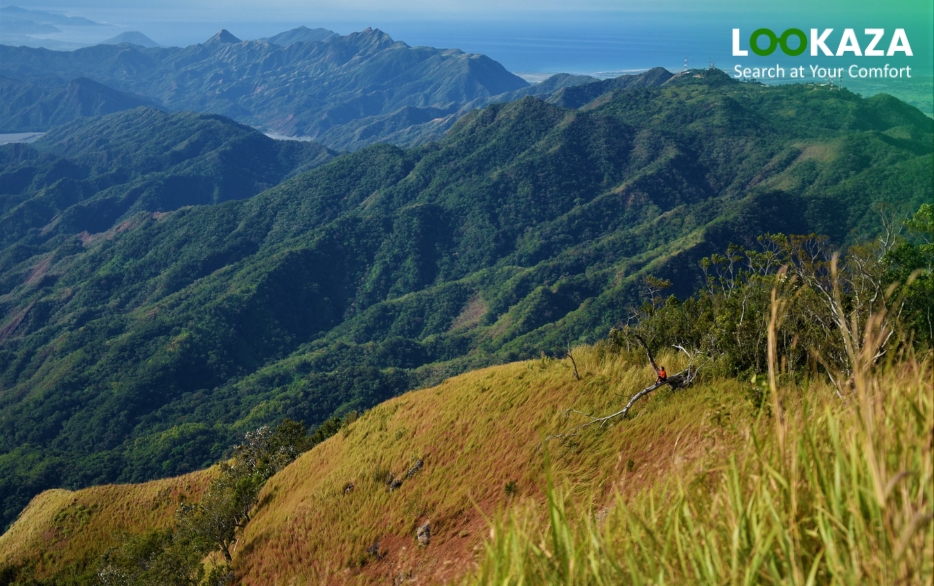
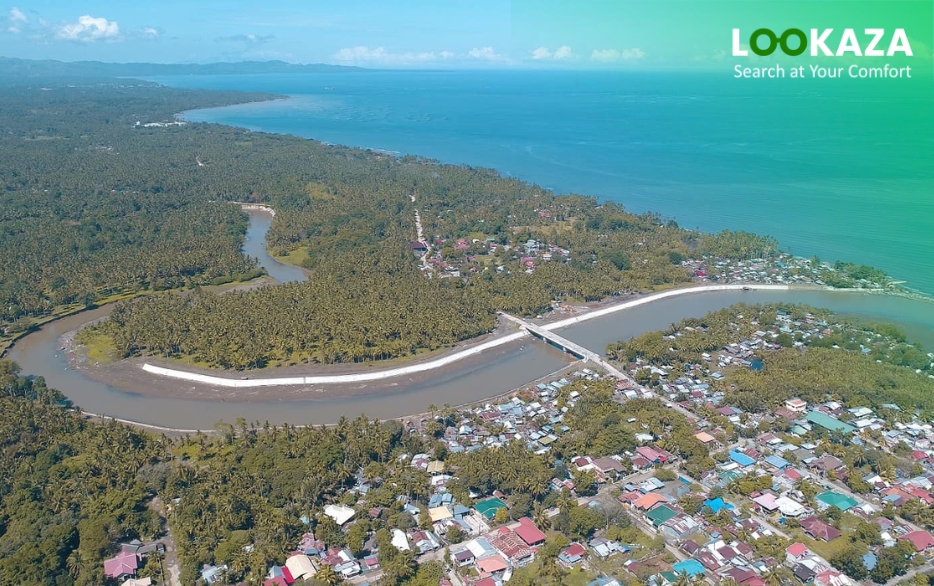
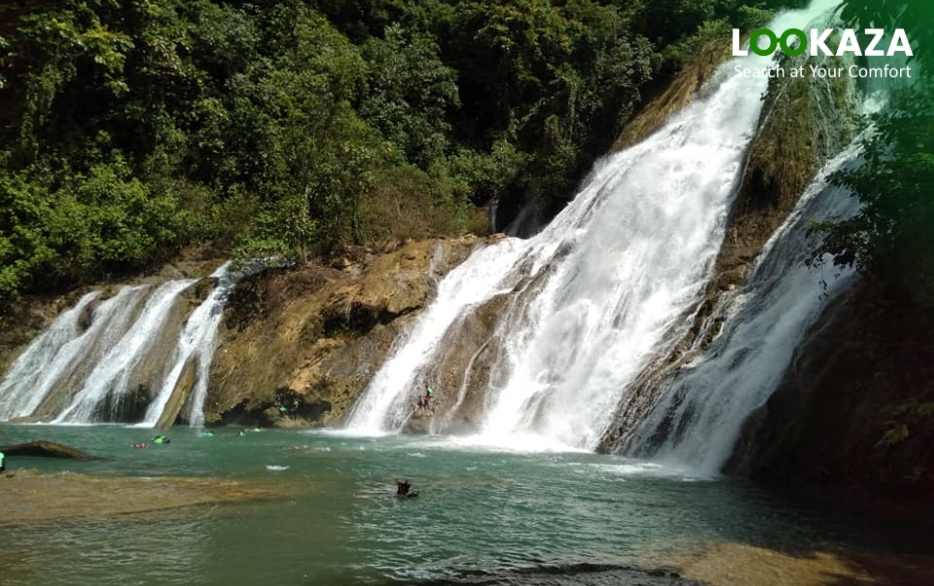
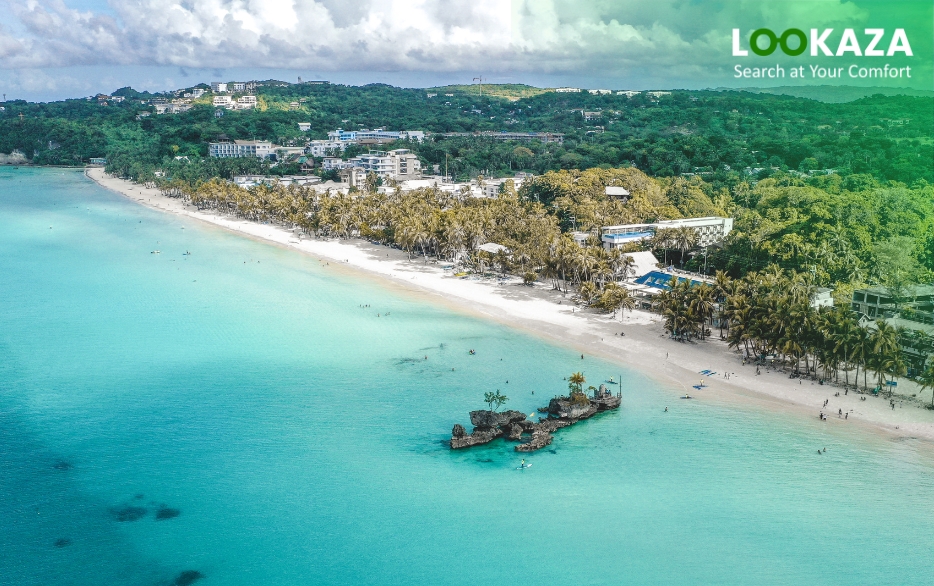
Tourism
Batangas is also home to several industrial parks, including the Batangas City Industrial Port Complex, the First Philippine Industrial Park in Santo Tomas, and the Sterling Technopark in Tanauan. These industrial parks house companies engaged in electronics, food processing, and automotive manufacturing, among others.
The province’s tourism industry is also thriving, thanks to its beautiful beaches, historical landmarks, and rich cultural heritage. Tourists flock to Batangas to visit landmarks such as the Taal Basilica, the Taal Heritage Town, and the Calatagan Lighthouse, among others.