Cagayan, officially referred to as the Province of Cagayan, is a province in the Philippines located in the Cagayan Valley region, encompassing the northeastern tip of Luzon. Tuguegarao serves as its capital. Situated approximately 431 kilometers (268 miles) northwest of Manila, the province also includes the Babuyan Islands to the north. Cagayan shares its borders with Ilocos Norte and Apayao to the west, and Kalinga and Isabela to the south.
During the Spanish colonial era, Cagayan was one of the early provinces and was known as “La Provincia de Cagayan.” Its territorial boundaries essentially covered the entire Cagayan Valley, which included the present-day provinces of Isabela, Quirino, Nueva Vizcaya, Batanes, and parts of Kalinga, Apayao, and Aurora. The former provincial capital was Nueva Segovia, which also served as the seat of the Diocese of Nueva Segovia. Today, only 9,295.75 square kilometers (3,589.11 square miles) remain of the once-extensive province. Nevertheless, the entire region is still collectively referred to as Cagayan Valley.
Demographics
According to the 2015 Census data for Cagayan, here’s a summary of the demographic information you provided:
- Age Groups and Populations:
- The age group with the highest population in Cagayan was individuals aged 5 to 9, totaling 123,736 individuals.
- The age group with the lowest population was those aged 80 and over, which included 13,277 individuals.
- Age Group Aggregates:
- When grouping age categories:
- Those aged 14 and below, including infants, babies, children, and young adolescents/teenagers, constituted approximately 30.43% of the total population, amounting to 364,950 individuals.
- The age group of 15 to 64, representing the economically active population and potential workforce, made up a significant 63.95% of the population, totaling 766,995 individuals.
- The old dependent population, consisting of senior citizens aged 65 and over, accounted for 5.62% of the total population, equivalent to 67,375 individuals.
- When grouping age categories:
- Age Dependency Ratios:
- The calculated Age Dependency Ratios provide insights into the population’s dependency on different age groups:
- For every 100 individuals in the working age population, there were 48 youth dependents (aged 14 and below) and 9 aged/senior citizens (aged 65 and over).
- In total, there were 56 dependents (combining young and old-age) for every 100 of the working population.
- The calculated Age Dependency Ratios provide insights into the population’s dependency on different age groups:
- Median Age:
- The median age of Cagayan in 2015 was 25 years. This statistic indicates that half of the population was younger than 25, while the other half was older than 25. It provides an essential measure of the age distribution within the province.
These statistics offer a comprehensive overview of the age distribution and dependency ratios in Cagayan as of 2015. Please keep in mind that demographic data can change over time due to various factors, such as birth rates, migration, and aging populations, so more recent data may reveal different patterns.
| Name | City/ Municipality | Population (2020) | Population (2015) | Annual Population Growth Rate (2015‑2020) | Area (km2) | Density (2020), per km2 | Brgy count |
|---|---|---|---|---|---|---|---|
| Abulug | municipality | 34,579 | 32,497 | 1.32% | 162.60 | 213 | 20 |
| Alcala | municipality | 41,295 | 38,883 | 1.28% | 168.64 | 245 | 25 |
| Allacapan | municipality | 35,234 | 33,571 | 1.02% | 306.80 | 115 | 27 |
| Amulung | municipality | 50,336 | 47,860 | 1.07% | 264.51 | 190 | 47 |
| Aparri | municipality | 68,839 | 65,649 | 1.00% | 286.64 | 240 | 42 |
| Baggao | municipality | 87,753 | 82,782 | 1.24% | 995.49 | 88 | 48 |
| Ballesteros | municipality | 34,488 | 34,299 | 0.12% | 120.00 | 287 | 19 |
| Buguey | municipality | 32,148 | 30,175 | 1.34% | 164.50 | 195 | 30 |
| Calayan | municipality | 17,410 | 16,702 | 0.88% | 494.53 | 35 | 12 |
| Camalaniugan | municipality | 25,236 | 24,923 | 0.26% | 76.50 | 330 | 28 |
| Claveria | municipality | 31,900 | 29,921 | 1.36% | 194.80 | 164 | 41 |
| Enrile | municipality | 36,705 | 35,834 | 0.51% | 166.60 | 220 | 22 |
| Gattaran | municipality | 58,874 | 56,661 | 0.81% | 707.50 | 83 | 50 |
| Gonzaga | municipality | 41,680 | 38,892 | 1.47% | 567.43 | 73 | 25 |
| Iguig | municipality | 30,060 | 27,862 | 1.61% | 109.90 | 274 | 23 |
| Lal-lo | municipality | 48,733 | 44,506 | 1.93% | 702.80 | 69 | 35 |
| Lasam | municipality | 41,225 | 39,135 | 1.10% | 213.70 | 193 | 30 |
| Pamplona | municipality | 24,781 | 23,596 | 1.04% | 209.67 | 118 | 18 |
| Peñablanca | municipality | 50,300 | 48,584 | 0.73% | 1,246.23 | 40 | 24 |
| Piat | municipality | 24,805 | 23,597 | 1.06% | 181.81 | 136 | 18 |
| Rizal | municipality | 19,077 | 17,994 | 1.24% | 124.40 | 153 | 29 |
| Sanchez-Mira | municipality | 26,164 | 24,541 | 1.36% | 218.77 | 120 | 18 |
| Santa Ana | municipality | 35,688 | 32,906 | 1.72% | 440.81 | 81 | 16 |
| Santa Praxedes | municipality | 4,434 | 4,154 | 1.38% | 78.11 | 57 | 10 |
| Santa Teresita | municipality | 19,573 | 19,038 | 0.59% | 166.98 | 117 | 13 |
| Santo Niño | municipality | 28,537 | 27,219 | 1.00% | 423.13 | 67 | 31 |
| Solana | municipality | 88,445 | 82,502 | 1.48% | 234.60 | 377 | 38 |
| Tuao | municipality | 63,970 | 61,535 | 0.82% | 225.82 | 283 | 32 |
| Tuguegarao | city (CC), capital, regional center | 166,334 | 153,502 | 1.70% | 144.80 | 1,149 | 49 |
| Cagayan Total | 1,268,603 | 1,199,320 | 1.19% | 9,398.07 | 135 | 820 | |
Economy
| Fiscal Year | Annual Regular Income | Change |
|---|---|---|
| 2009 | 1,160,371,494.00 | – |
| 2010 | 1,281,783,293.94 | 10.46% |
| 2011 | 1,377,741,046.56 | 7.49% |
| 2012 | 1,344,672,506.78 | -2.40% |
| 2013 | 1,461,644,943.25 | 8.70% |
| 2014 | 1,635,793,715.14 | 11.91% |
| 2015 | 1,796,934,828.23 | 9.85% |
| 2016 | 1,958,333,928.62 | 8.98% |
| End notes:Annual Regular Income = Locally Sourced Revenue + Internal Revenue Allotment (IRA) Current Year + Other Shares from National Tax CollectionLocally Sourced Revenue = Real Property Tax (General Fund) + Tax on Business + Other Taxes + Regulatory Fees + Service/User Charges + Receipts from Economic Enterprises | ||
Tourism
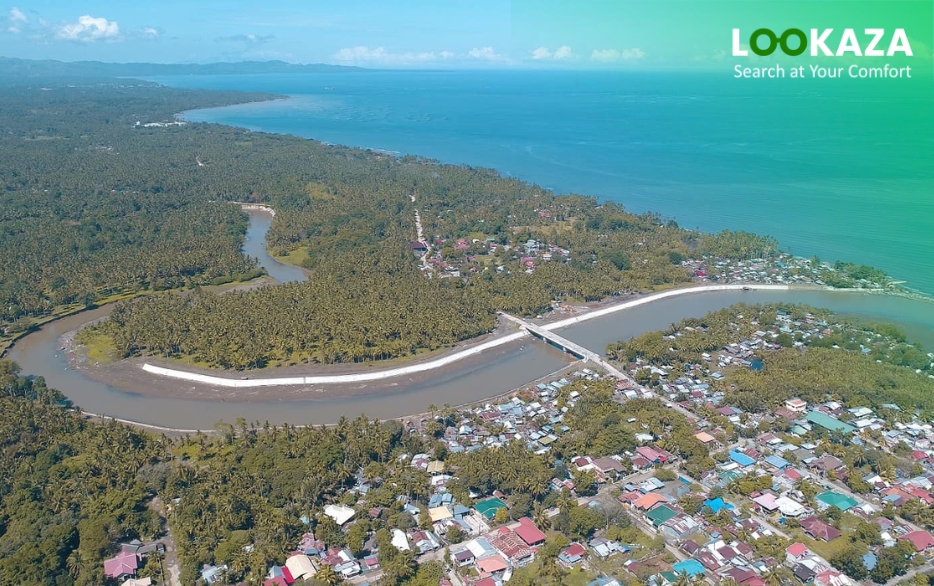
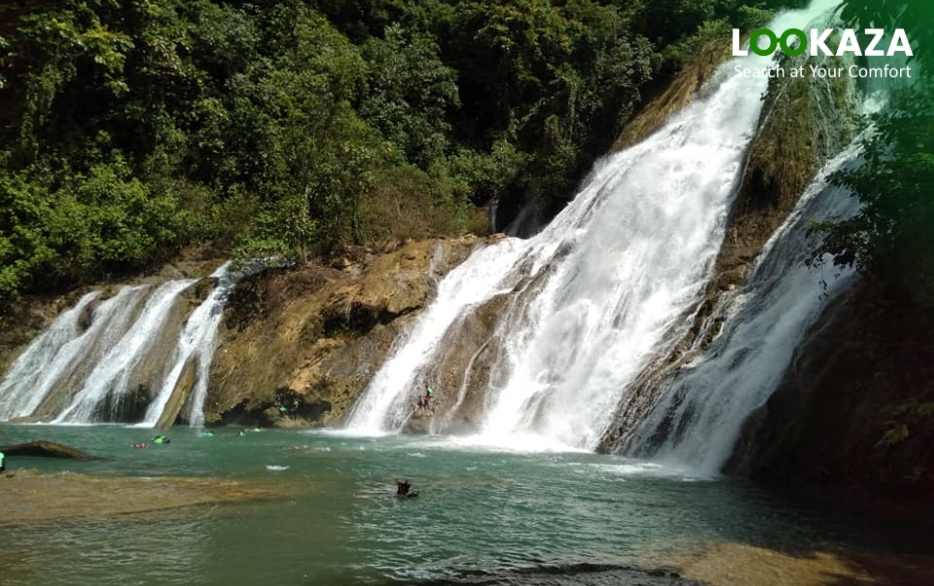
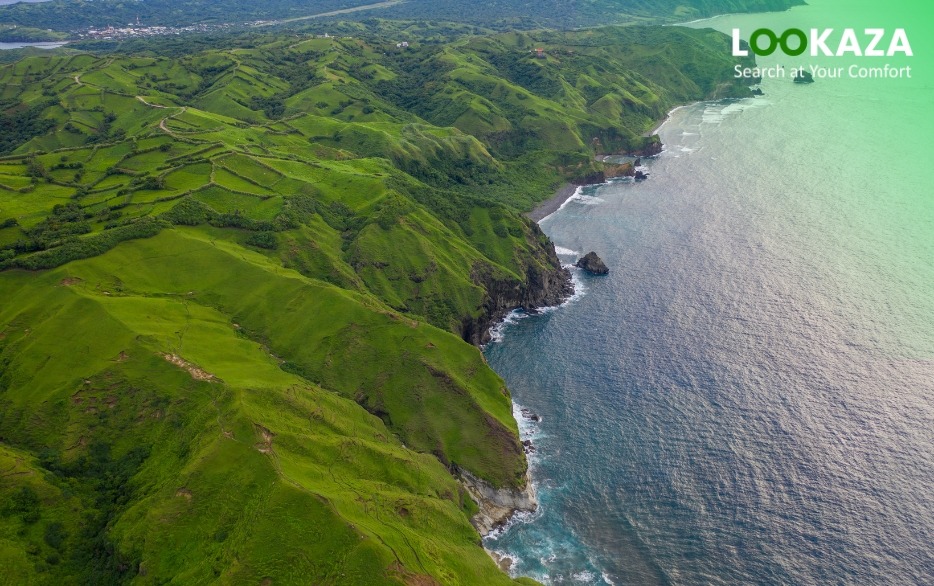
Cagayan is a hidden gem for tourists seeking unique experiences. The province boasts diverse attractions, from its pristine beaches along the Babuyan Channel to the breathtaking Sierra Madre Mountain Range. Tuguegarao City offers a taste of history and culture with its centuries-old St. Peter’s Cathedral and the Cagayan Provincial Museum and Historical Research Center.
Adventurers can explore the Callao Caves, known for its stunning limestone formations and underground chapel. The Palaui Island National Park, a marine and terrestrial protected area, entices nature enthusiasts with its rich biodiversity and pristine beaches.
Cagayan’s festivals, such as the Panagbenga Festival and the Paggay Festival, showcase the province’s vibrant culture and traditions.