
Cebu, officially known as the Province of Cebu (Cebuano: Lalawigan sa Sugbo; Tagalog: Lalawigan ng Cebu), is a province located in the Central Visayas (Region VII) region of the Philippines. It is comprised of a main island and 167 surrounding islands and islets. The capital and largest city of Cebu is Cebu City, which is often referred to as “the Queen City of the South.” This city, the oldest in the Philippines, serves as the first capital and is politically independent from the provincial government.
The Cebu Metropolitan Area, or Metro Cebu, is the second largest metropolitan area in the Philippines, following Metro Manila. Cebu City is the central hub for commerce, trade, education, and industry in the Visayas. Over the past decade, Cebu has evolved into one of the most developed provinces in the Philippines, establishing itself as a global center for business processing services, tourism, shipping, furniture production, and heavy industry. The Mactan–Cebu International Airport, located on Mactan Island, is the second busiest airport in the Philippines.
Demographics
According to the 2015 Census data for Cebu, here’s a summary of the demographic information you provided:
- Age Groups and Populations:
- The age group with the highest population in Cebu was individuals aged 5 to 9, totaling 509,058 individuals.
- The age group with the lowest population was those aged 80 and over, comprising 34,799 individuals.
- Age Group Aggregates:
- When grouping age categories:
- Those aged 14 and below, which includes infants, babies, children, and young adolescents/teenagers, made up approximately 32.59% of the total population, amounting to 1,509,885 individuals.
- The age group of 15 to 64, representing the economically active population and potential workforce, constituted a significant 62.79% of the population, totaling 2,908,471 individuals.
- The old dependent population, consisting of senior citizens aged 65 and over, accounted for 4.62% of the total population, equivalent to 214,003 individuals.
- When grouping age categories:
- Age Dependency Ratios:
- The calculated Age Dependency Ratios provide insights into the population’s dependency on different age groups:
- For every 100 individuals in the working age population, there were 52 youth dependents (aged 14 and below) and 7 aged/senior citizens (aged 65 and over).
- In total, there were 59 dependents (combining young and old-age) for every 100 of the working population.
- The calculated Age Dependency Ratios provide insights into the population’s dependency on different age groups:
- Median Age:
- The median age of Cebu in 2015 was 24 years. This statistic indicates that half of the population was younger than 24, while the other half was older than 24. It provides an essential measure of the age distribution within the province.
These statistics offer a comprehensive overview of the age distribution and dependency ratios in Cebu as of 2015. Please note that demographic data can change over time due to various factors, such as birth rates, migration, and aging populations, so more recent data may reveal different patterns.
| Name | City/ Municipality | Population (2020) | Population (2015) | Annual Population Growth Rate (2015‑2020) | Area (km2) | Density (2020), per km2 | Brgy count |
|---|---|---|---|---|---|---|---|
| Alcantara | municipality | 16,910 | 15,160 | 2.33% | 35.20 | 480 | 9 |
| Alcoy | municipality | 19,186 | 16,979 | 2.61% | 61.63 | 311 | 8 |
| Alegria | municipality | 25,620 | 23,300 | 2.02% | 89.49 | 286 | 9 |
| Aloguinsan | municipality | 34,466 | 32,100 | 1.51% | 61.92 | 557 | 15 |
| Argao | municipality | 78,187 | 72,366 | 1.64% | 191.50 | 408 | 45 |
| Asturias | municipality | 55,397 | 47,857 | 3.13% | 190.45 | 291 | 27 |
| Badian | municipality | 43,735 | 37,912 | 3.05% | 110.07 | 397 | 29 |
| Balamban | municipality | 95,136 | 87,177 | 1.86% | 333.56 | 285 | 28 |
| Bantayan | municipality | 86,247 | 79,084 | 1.84% | 81.68 | 1,056 | 25 |
| Barili | municipality | 80,715 | 73,862 | 1.89% | 122.21 | 660 | 42 |
| Bogo | city (CC) | 88,867 | 78,120 | 2.75% | 103.52 | 858 | 29 |
| Boljoon | municipality | 17,525 | 16,344 | 1.48% | 117.00 | 150 | 11 |
| Borbon | municipality | 38,187 | 35,526 | 1.53% | 120.94 | 316 | 19 |
| Carcar | city (CC) | 136,453 | 119,664 | 2.80% | 116.78 | 1,168 | 15 |
| Carmen | municipality | 57,897 | 51,325 | 2.57% | 84.78 | 683 | 21 |
| Catmon | municipality | 33,745 | 30,471 | 2.17% | 109.64 | 308 | 20 |
| Compostela | municipality | 55,874 | 47,898 | 3.30% | 53.90 | 1,037 | 17 |
| Consolacion | municipality | 148,012 | 131,528 | 2.52% | 147.20 | 1,006 | 21 |
| Cordova | municipality | 70,595 | 59,712 | 3.59% | 17.15 | 4,116 | 13 |
| Daanbantayan | municipality | 93,502 | 84,430 | 2.17% | 92.27 | 1,013 | 20 |
| Dalaguete | municipality | 74,596 | 67,497 | 2.13% | 154.96 | 481 | 33 |
| Danao | city (CC) | 156,321 | 136,471 | 2.90% | 107.30 | 1,457 | 42 |
| Dumanjug | municipality | 57,823 | 51,210 | 2.59% | 85.53 | 676 | 37 |
| Ginatilan | municipality | 16,906 | 15,919 | 1.27% | 70.10 | 241 | 14 |
| Liloan | municipality | 153,197 | 118,753 | 5.51% | 45.92 | 3,336 | 14 |
| Madridejos | municipality | 42,039 | 36,429 | 3.06% | 23.95 | 1,755 | 14 |
| Malabuyoc | municipality | 19,770 | 19,373 | 0.43% | 69.27 | 285 | 14 |
| Medellin | municipality | 59,605 | 55,332 | 1.58% | 73.19 | 814 | 19 |
| Minglanilla | municipality | 151,002 | 132,135 | 2.85% | 65.60 | 2,302 | 19 |
| Moalboal | municipality | 36,930 | 31,130 | 3.66% | 124.86 | 296 | 15 |
| Naga | city (CC) | 133,184 | 115,750 | 3.00% | 101.97 | 1,306 | 28 |
| Oslob | municipality | 29,264 | 27,893 | 1.02% | 134.75 | 217 | 21 |
| Pilar | municipality | 12,506 | 11,308 | 2.14% | 32.42 | 386 | 13 |
| Pinamungajan | municipality | 75,131 | 65,955 | 2.78% | 109.16 | 688 | 26 |
| Poro | municipality | 26,232 | 25,212 | 0.84% | 63.59 | 413 | 17 |
| Ronda | municipality | 21,005 | 20,360 | 0.66% | 57.10 | 368 | 14 |
| Samboan | municipality | 20,373 | 20,884 | -0.52% | 45.16 | 451 | 15 |
| San Fernando | municipality | 72,224 | 66,280 | 1.82% | 69.39 | 1,041 | 21 |
| San Francisco | municipality | 59,236 | 55,180 | 1.50% | 106.93 | 554 | 15 |
| San Remigio | municipality | 65,744 | 57,557 | 2.84% | 95.27 | 690 | 27 |
| Santa Fe | municipality | 34,471 | 28,603 | 4.01% | 28.05 | 1,229 | 10 |
| Santander | municipality | 18,527 | 17,857 | 0.78% | 29.53 | 627 | 10 |
| Sibonga | municipality | 53,424 | 48,186 | 2.20% | 133.45 | 400 | 25 |
| Sogod | municipality | 39,447 | 35,108 | 2.48% | 119.23 | 331 | 18 |
| Tabogon | municipality | 41,432 | 39,013 | 1.27% | 101.35 | 409 | 25 |
| Tabuelan | municipality | 28,907 | 25,630 | 2.57% | 141.13 | 205 | 12 |
| Talisay | city (CC) | 263,048 | 227,645 | 3.09% | 39.87 | 6,598 | 22 |
| Toledo | city (CC) | 207,314 | 170,335 | 4.22% | 216.28 | 959 | 38 |
| Tuburan | municipality | 68,167 | 63,866 | 1.38% | 224.50 | 304 | 54 |
| Tudela | municipality | 11,304 | 11,296 | 0.01% | 33.02 | 342 | 11 |
| Cebu Total | 3,325,385 | 2,938,982 | 2.63% | 4,943.72 | 673 | 1,066 | |
Economy
| Fiscal Year | Annual Regular Income | Change |
|---|---|---|
| 2009 | 1,686,096,319.15 | – |
| 2010 | 1,792,094,858.42 | 6.29% |
| 2011 | 1,983,665,242.59 | 10.69% |
| 2012 | 1,895,361,909.63 | -4.45% |
| 2013 | 2,209,380,437.90 | 16.57% |
| 2014 | 2,414,594,998.57 | 9.29% |
| 2015 | 2,775,218,466.21 | 14.94% |
| 2016 | 3,068,242,643.24 | 10.56% |
| End notes:Annual Regular Income = Locally Sourced Revenue + Internal Revenue Allotment (IRA) Current Year + Other Shares from National Tax CollectionLocally Sourced Revenue = Real Property Tax (General Fund) + Tax on Business + Other Taxes + Regulatory Fees + Service/User Charges + Receipts from Economic Enterprises | ||
Tourism
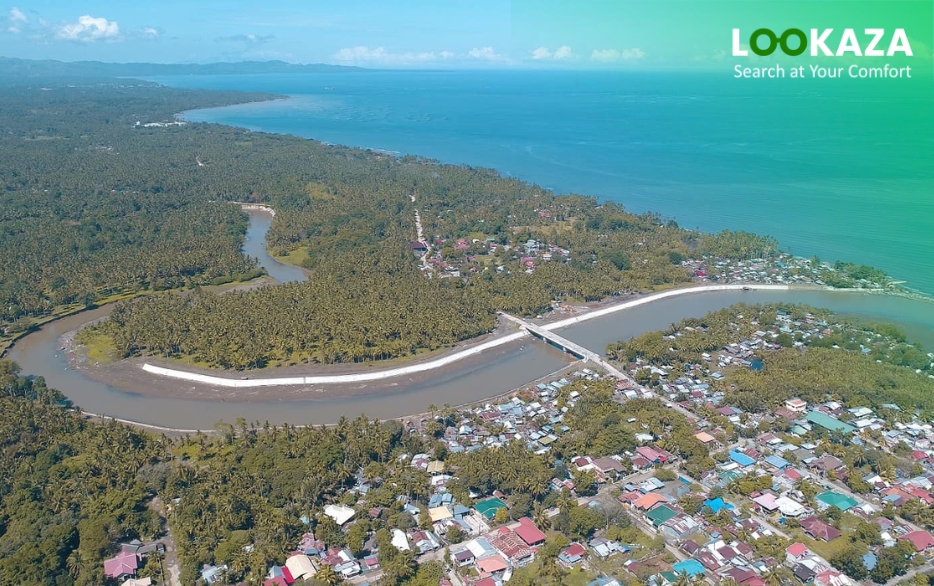
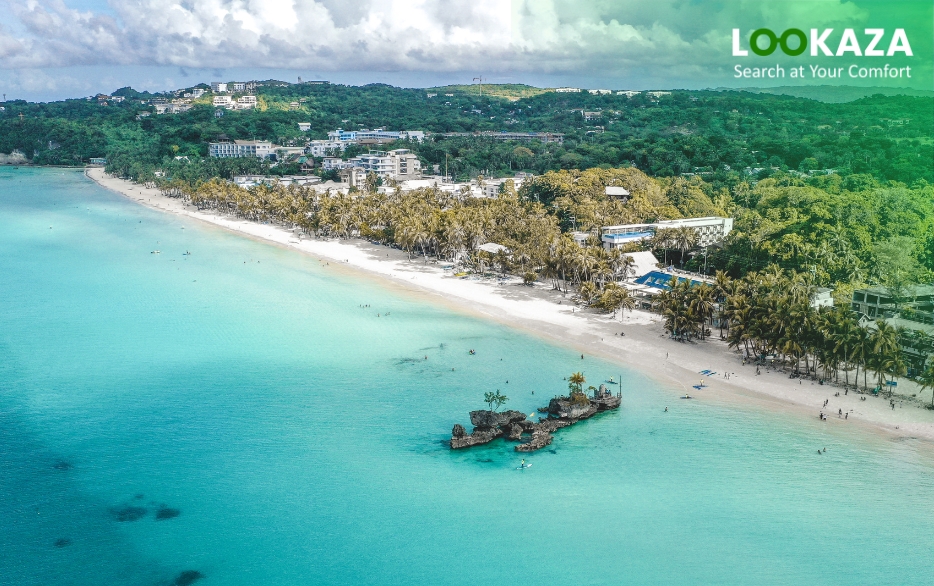
Cebu’s tourism industry offers a tapestry of experiences that blend history, culture, and contemporary excitement. Visitors can explore historical sites like Magellan’s Cross, savor the rich flavors of Cebuano cuisine, and immerse themselves in vibrant festivals and the province’s dynamic arts scene.
The province’s modernity coexists with its heritage, creating a unique juxtaposition of experiences for tourists. The pristine beaches, vibrant cities, and natural wonders offer a diverse range of attractions, making Cebu a destination that caters to all interests.