
Eastern Samar, known as Sinirangan Samar in Waray-Waray and Silangang Samar in Tagalog, is officially designated as the Province of Eastern Samar. It is a province situated in the Philippines within the Eastern Visayas region. The city of Borongan serves as its capital. Eastern Samar is located on the eastern part of Samar Island. The province shares its borders with Northern Samar to the north and Samar province to the west. To the east, it is bounded by the Philippine Sea, a part of the expansive Pacific Ocean, while to the south, it is bordered by Leyte Gulf.
Demographics
According to the 2015 Census data for Eastern Samar, here’s a summary of the demographic information you provided:
- Age Groups and Populations:
- The age group with the highest population in Eastern Samar was individuals aged 10 to 14, totaling 55,415 individuals.
- The age group with the lowest population was those aged 80 and over, which included 5,712 individuals.
- Age Group Aggregates:
- When grouping age categories:
- Those aged 14 and below, including infants, babies, children, and young adolescents/teenagers, constituted approximately 34.32% of the total population, amounting to 160,323 individuals.
- The age group of 15 to 64, representing the economically active population and potential workforce, made up a significant 59.13% of the population, totaling 276,251 individuals.
- The old dependent population, consisting of senior citizens aged 65 and over, accounted for 6.55% of the total population, equivalent to 30,586 individuals.
- When grouping age categories:
- Age Dependency Ratios:
- The calculated Age Dependency Ratios provide insights into the population’s dependency on different age groups:
- For every 100 individuals in the working age population, there were 58 youth dependents (aged 14 and below) and 11 aged/senior citizens (aged 65 and over).
- In total, there were 69 dependents (combining young and old-age) for every 100 of the working population.
- The calculated Age Dependency Ratios provide insights into the population’s dependency on different age groups:
- Median Age:
- The median age of Eastern Samar in 2015 was 22 years. This statistic indicates that half of the population was younger than 22, while the other half was older than 22. It provides an essential measure of the age distribution within the province.
These statistics offer a comprehensive overview of the age distribution and dependency ratios in Eastern Samar as of 2015. Please keep in mind that demographic data can change over time due to various factors, such as birth rates, migration, and aging populations, so more recent data may reveal different patterns.
| Name | City/ Municipality | Population (2020) | Population (2015) | Annual Population Growth Rate (2015‑2020) | Area (km2) | Density (2020), per km2 | Brgy count |
|---|---|---|---|---|---|---|---|
| Arteche | municipality | 16,360 | 16,026 | 0.44% | 138.81 | 118 | 20 |
| Balangiga | municipality | 14,341 | 14,085 | 0.38% | 190.05 | 75 | 13 |
| Balangkayan | municipality | 10,185 | 10,125 | 0.12% | 207.05 | 49 | 15 |
| Borongan | city (CC), capital | 71,961 | 69,297 | 0.80% | 475.00 | 151 | 61 |
| Can-avid | municipality | 21,682 | 21,015 | 0.66% | 288.70 | 75 | 28 |
| Dolores | municipality | 44,626 | 42,866 | 0.85% | 308.58 | 145 | 46 |
| General MacArthur | municipality | 14,411 | 14,550 | -0.20% | 117.29 | 123 | 30 |
| Giporlos | municipality | 13,117 | 13,308 | -0.30% | 97.51 | 135 | 18 |
| Guiuan | municipality | 53,361 | 52,991 | 0.15% | 175.49 | 304 | 60 |
| Hernani | municipality | 8,531 | 8,573 | -0.10% | 49.42 | 173 | 13 |
| Jipapad | municipality | 8,439 | 7,885 | 1.44% | 234.80 | 36 | 13 |
| Lawaan | municipality | 13,003 | 12,742 | 0.43% | 162.56 | 80 | 16 |
| Llorente | municipality | 21,459 | 20,149 | 1.34% | 496.07 | 43 | 33 |
| Maslog | municipality | 5,463 | 5,407 | 0.22% | 249.80 | 22 | 12 |
| Maydolong | municipality | 15,314 | 14,743 | 0.80% | 399.63 | 38 | 20 |
| Mercedes | municipality | 6,112 | 6,070 | 0.15% | 23.32 | 262 | 16 |
| Oras | municipality | 37,451 | 36,540 | 0.52% | 188.70 | 198 | 42 |
| Quinapondan | municipality | 14,507 | 14,779 | -0.39% | 83.24 | 174 | 25 |
| Salcedo | municipality | 22,136 | 22,532 | -0.37% | 113.80 | 195 | 41 |
| San Julian | municipality | 14,800 | 14,498 | 0.43% | 150.62 | 98 | 16 |
| San Policarpo | municipality | 15,365 | 14,687 | 0.95% | 65.70 | 234 | 17 |
| Sulat | municipality | 15,758 | 15,377 | 0.52% | 169.75 | 93 | 18 |
| Taft | municipality | 18,786 | 18,915 | -0.14% | 231.27 | 81 | 24 |
| Eastern Samar Total | 477,168 | 467,160 | 0.45% | 4,617.16 | 103 | 597 | |
Economy
| Fiscal Year | Annual Regular Income | Change |
|---|---|---|
| 2009 | 600,598,183.00 | – |
| 2010 | 654,483,519.00 | 8.97% |
| 2011 | 687,488,438.45 | 5.04% |
| 2012 | 670,198,067.27 | -2.52% |
| 2013 | 743,049,321.66 | 10.87% |
| 2014 | 830,844,178.20 | 11.82% |
| 2015 | 956,727,656.13 | 15.15% |
| 2016 | 1,038,170,388.30 | 8.51% |
| End notes:Annual Regular Income = Locally Sourced Revenue + Internal Revenue Allotment (IRA) Current Year + Other Shares from National Tax CollectionLocally Sourced Revenue = Real Property Tax (General Fund) + Tax on Business + Other Taxes + Regulatory Fees + Service/User Charges + Receipts from Economic Enterprises | ||
Tourism
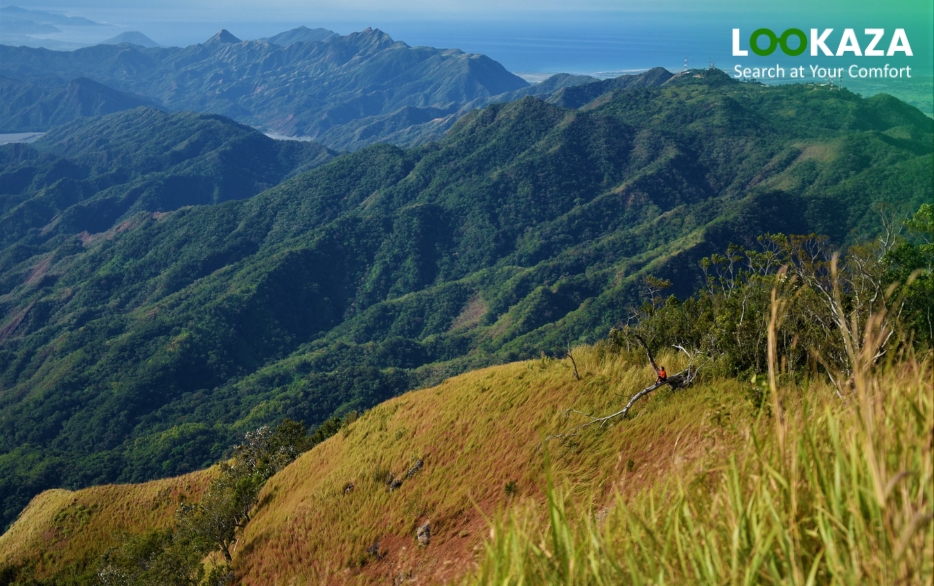
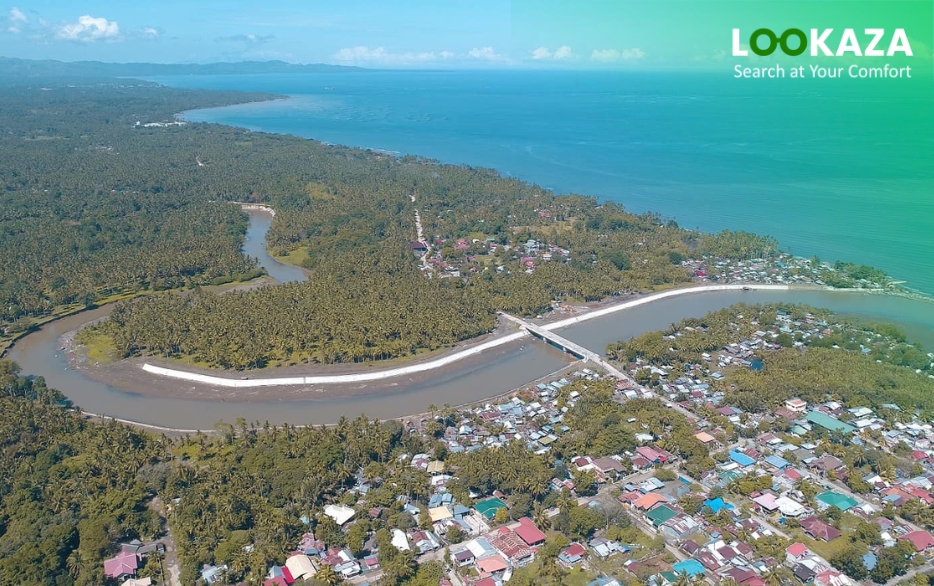
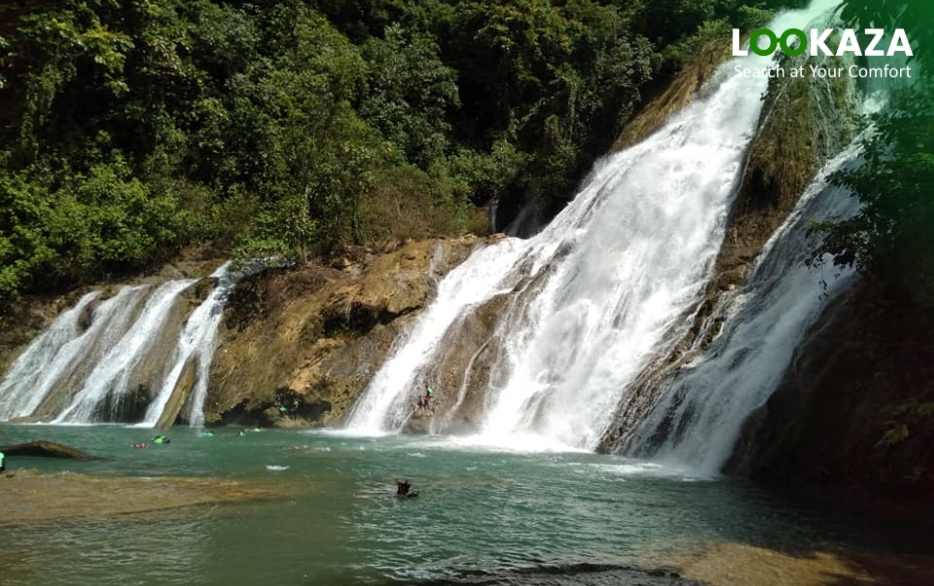
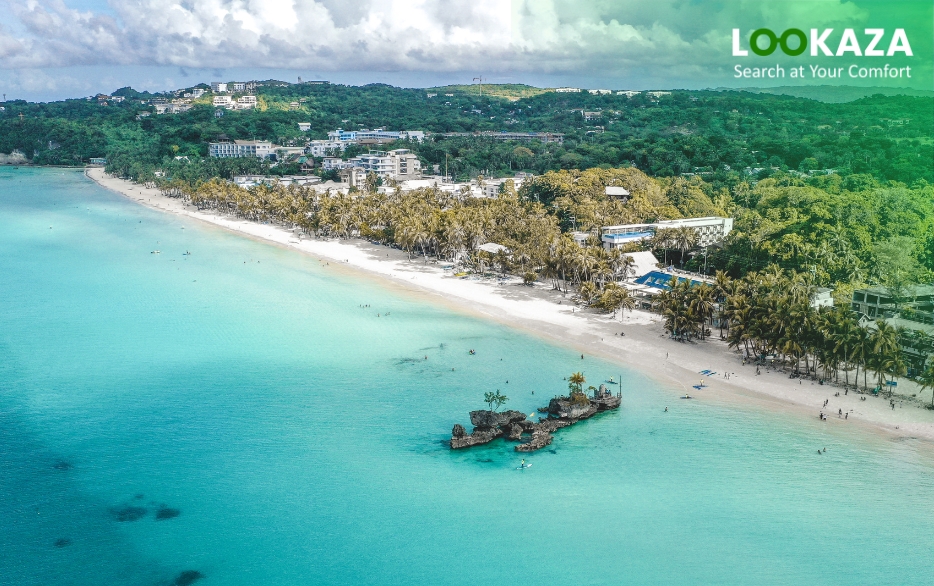
Eastern Samar’s tourism industry thrives on its untouched natural beauty, cultural treasures, and serene ambiance. The province boasts enchanting destinations like the stunning Calicoan Island, the pristine Divinubo Island, and the captivating Balangiga Encounter Monument.
Nature enthusiasts can embark on thrilling eco-adventures, immerse themselves in local festivals, or savor indigenous delicacies that reflect Eastern Samar’s unique flavors. Eastern Samar’s cuisine offers a culinary adventure that tantalizes the senses.