
Leyte is a province in the Philippines located in the Eastern Visayas region. Its capital is Tacloban City, a highly urbanized city and the largest in the region. Leyte is known for its rich history, scenic landscapes, and cultural heritage. The province is famous for the historic Battle of Leyte Gulf, one of the largest naval battles in World War II, which took place off its coast.
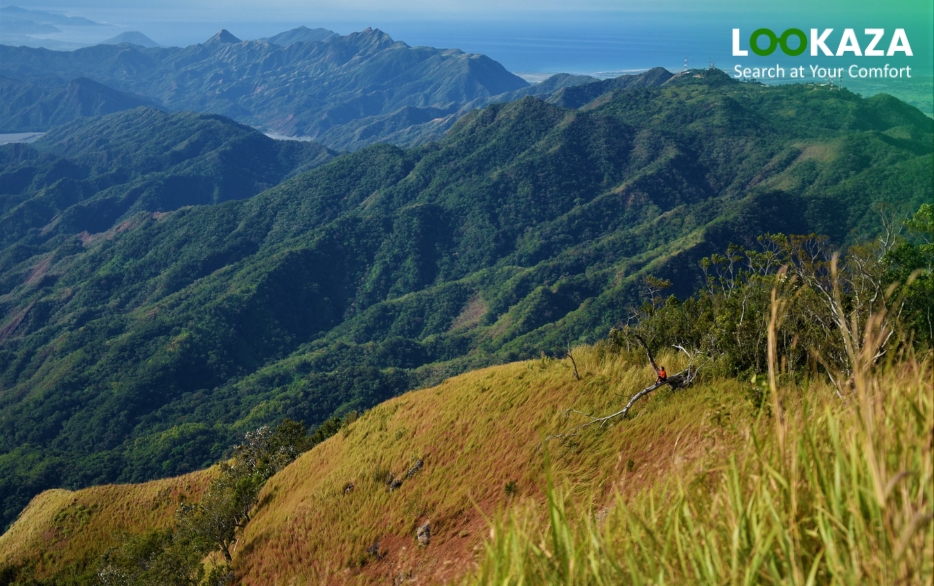
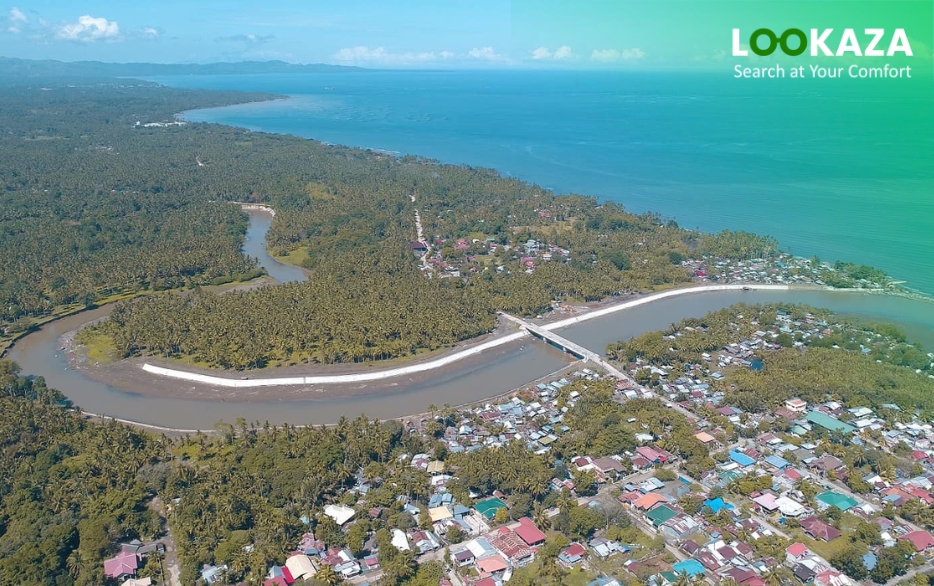
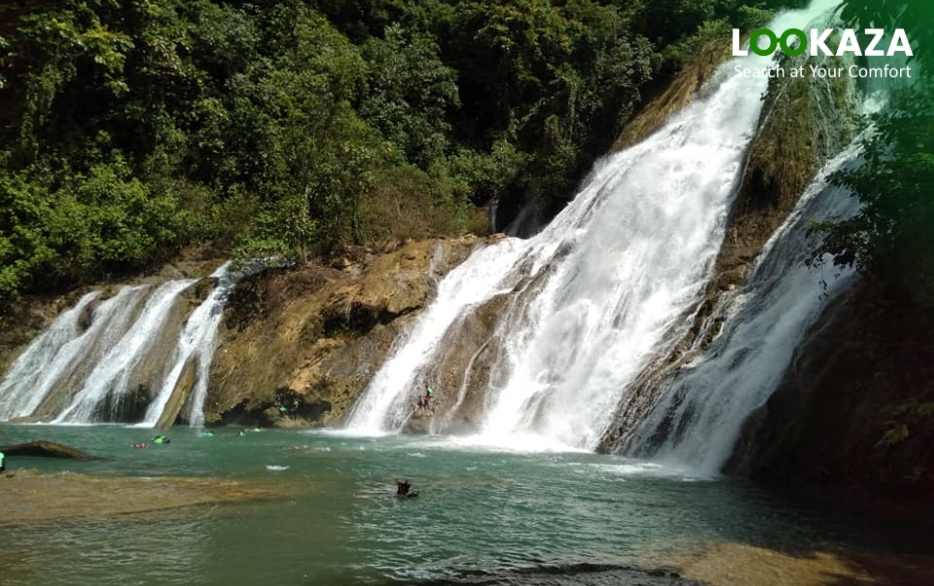
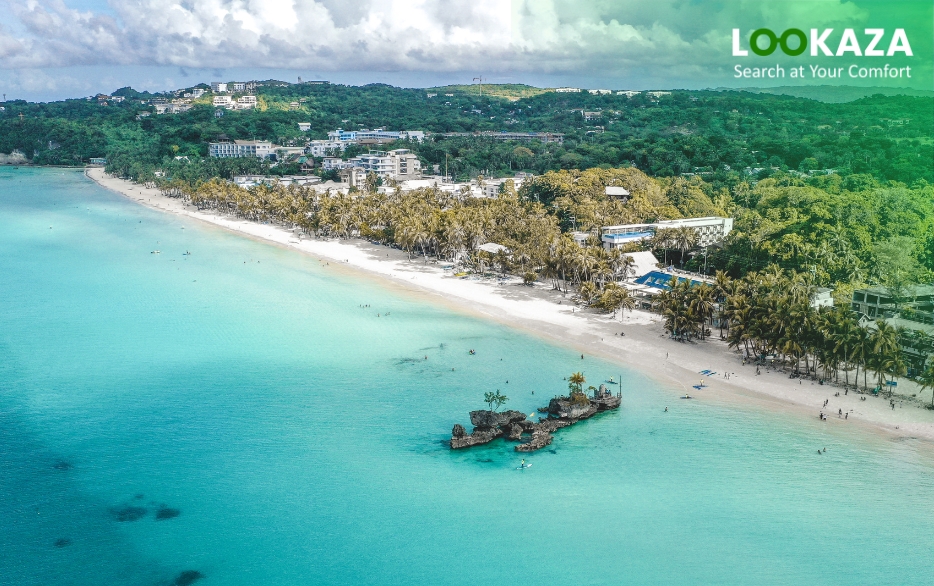
Leyte is also home to several natural attractions, including the San Juanico Bridge, which connects Leyte to the island of Samar and is the longest bridge in the Philippines. The province is blessed with beautiful beaches, waterfalls, and caves, making it a popular destination for nature lovers and adventurers. One notable natural wonder is the Cuatro Islas (Four Islands), a group of islands known for their pristine beaches and clear waters.
Demographics
Population by Age Group – Leyte (2015 Census):
1. Age Groups and Populations:
- The age group with the highest population: 5 to 9 years old, totaling 221,000 individuals.
- The age group with the lowest population: 80 and over, comprising 17,957 individuals.
2. Age Group Aggregates:
- Young Dependents (aged 14 and below): Make up a significant 33.42% of the total population, with 657,274 individuals. This group includes infants, babies, children, and young adolescents/teenagers.
- Economically Active Population (aged 15 to 64): Represents 60.96% of the population, totaling 1,198,893 individuals. This group includes individuals who are part of the workforce or have the potential to join.
- Old Dependents (aged 65 and over): Account for 5.62% of the total population, which is 110,601 individuals, and consists of senior citizens.
3. Age Dependency Ratios:
- Among the population of Leyte, there are 55 youth dependents (aged 14 and below) for every 100 individuals in the working age population.
- There are 9 aged/senior citizens (aged 65 and over) for every 100 of the working population.
- Overall, there are 64 dependents (combining young and old-age) for every 100 of the working population. These ratios provide insights into the population’s dependency on different age groups.
4. Median Age:
- The median age of Leyte in 2015 was 23 years. This statistic indicates that half of the entire population was younger than 23, while the other half was older than 23. It provides a vital measure of the age distribution within the province.
This structured format offers a clear overview of the age distribution and dependency ratios in Leyte based on the 2015 Census data.
| Name | City/ Municipality | Population (2020) | Population (2015) | Annual Population Growth Rate (2015‑2020) | Area (km2) | Density (2020), per km2 | Brgy count |
|---|---|---|---|---|---|---|---|
| Abuyog | municipality | 61,216 | 59,571 | 0.58% | 688.25 | 89 | 63 |
| Alangalang | municipality | 57,185 | 55,235 | 0.73% | 150.54 | 380 | 54 |
| Albuera | municipality | 47,151 | 46,332 | 0.37% | 303.35 | 155 | 16 |
| Babatngon | municipality | 28,823 | 27,797 | 0.77% | 115.18 | 250 | 25 |
| Barugo | municipality | 34,497 | 32,745 | 1.10% | 84.62 | 408 | 37 |
| Bato | municipality | 38,505 | 38,356 | 0.08% | 72.45 | 531 | 32 |
| Baybay | city (CC) | 111,848 | 109,432 | 0.46% | 459.34 | 243 | 92 |
| Burauen | municipality | 52,511 | 52,732 | -0.09% | 265.33 | 198 | 77 |
| Calubian | municipality | 31,646 | 31,228 | 0.28% | 100.95 | 313 | 53 |
| Capoocan | municipality | 33,721 | 33,617 | 0.07% | 185.40 | 182 | 21 |
| Carigara | municipality | 54,656 | 51,345 | 1.32% | 117.86 | 464 | 49 |
| Dagami | municipality | 36,178 | 35,147 | 0.61% | 161.65 | 224 | 65 |
| Dulag | municipality | 48,992 | 47,300 | 0.74% | 110.70 | 443 | 45 |
| Hilongos | municipality | 64,514 | 63,431 | 0.36% | 192.92 | 334 | 51 |
| Hindang | municipality | 20,849 | 20,924 | -0.08% | 57.66 | 362 | 20 |
| Inopacan | municipality | 21,389 | 20,550 | 0.85% | 109.11 | 196 | 20 |
| Isabel | municipality | 46,781 | 46,915 | -0.06% | 64.01 | 731 | 24 |
| Jaro | municipality | 43,758 | 43,199 | 0.27% | 207.19 | 211 | 46 |
| Javier | municipality | 26,658 | 25,379 | 1.04% | 152.70 | 175 | 28 |
| Julita | municipality | 15,598 | 15,114 | 0.67% | 53.30 | 293 | 26 |
| Kananga | municipality | 59,696 | 56,575 | 1.14% | 144.20 | 414 | 23 |
| La Paz | municipality | 19,174 | 19,998 | -0.88% | 72.70 | 264 | 35 |
| Leyte | municipality | 40,397 | 40,639 | -0.13% | 181.26 | 223 | 30 |
| MacArthur | municipality | 21,578 | 21,211 | 0.36% | 57.57 | 375 | 31 |
| Mahaplag | municipality | 27,865 | 27,823 | 0.03% | 104.79 | 266 | 28 |
| Matag-ob | municipality | 17,522 | 18,373 | -0.99% | 104.40 | 168 | 21 |
| Matalom | municipality | 32,586 | 33,121 | -0.34% | 132.00 | 247 | 30 |
| Mayorga | municipality | 18,071 | 17,161 | 1.09% | 42.17 | 429 | 16 |
| Merida | municipality | 31,574 | 29,863 | 1.18% | 95.21 | 332 | 22 |
| Ormoc | city (ICC) | 230,998 | 215,031 | 1.52% | 613.60 | 376 | 110 |
| Palo | municipality | 76,213 | 70,052 | 1.79% | 221.27 | 344 | 33 |
| Palompon | municipality | 58,313 | 58,108 | 0.07% | 126.07 | 463 | 50 |
| Pastrana | municipality | 19,359 | 18,002 | 1.54% | 86.35 | 224 | 29 |
| San Isidro | municipality | 30,722 | 31,641 | -0.62% | 122.50 | 251 | 19 |
| San Miguel | municipality | 19,753 | 19,420 | 0.36% | 145.11 | 136 | 21 |
| Santa Fe | municipality | 22,102 | 20,439 | 1.66% | 53.97 | 410 | 20 |
| Tabango | municipality | 33,868 | 34,195 | -0.20% | 96.62 | 351 | 13 |
| Tabontabon | municipality | 11,902 | 11,204 | 1.28% | 24.18 | 492 | 16 |
| Tanauan | municipality | 57,455 | 55,021 | 0.92% | 78.41 | 733 | 54 |
| Tolosa | municipality | 20,708 | 20,978 | -0.27% | 22.54 | 919 | 15 |
| Tunga | municipality | 7,656 | 7,584 | 0.20% | 7.70 | 994 | 8 |
| Villaba | municipality | 42,859 | 41,891 | 0.48% | 150.31 | 285 | 35 |
| Leyte Total | 1,776,847 | 1,724,679 | 0.63% | 6,335.44 | 280 | 1,503 | |
Economy
| Fiscal Year | Annual Regular Income | Change |
|---|---|---|
| 2009 | 1,222,716,686.36 | – |
| 2010 | 1,289,639,346.59 | 5.47% |
| 2011 | 1,356,582,817.57 | 5.19% |
| 2012 | 1,326,530,324.53 | -2.22% |
| 2013 | – | – |
| 2014 | 1,793,424,239.07 | – |
| 2015 | 2,074,108,449.86 | 15.65% |
| 2016 | 2,327,165,586.80 | 12.20% |
| End notes:Annual Regular Income = Locally Sourced Revenue + Internal Revenue Allotment (IRA) Current Year + Other Shares from National Tax CollectionLocally Sourced Revenue = Real Property Tax (General Fund) + Tax on Business + Other Taxes + Regulatory Fees + Service/User Charges + Receipts from Economic Enterprises | ||
Tourism
Leyte’s tourism industry offers a rich tapestry of experiences that blend history, culture, and natural beauty. Visitors can explore historic sites like the Red Beach, savor the rich flavors of Leyteño cuisine, and immerse themselves in vibrant festivals and the province’s dynamic arts scene.
The province’s heritage sites, unspoiled nature, and warm hospitality offer a diverse range of attractions, making Leyte a destination that caters to all interests.