
In the heart of Western Mindanao, where the tranquil coastal beauty meets rolling hills and vibrant communities, Zamboanga Sibugay unfurls as a province where dreams are meticulously crafted. Celebrated for its diverse demographics, flourishing real estate landscape, essential healthcare services, commitment to educational excellence, and the allure of coastal serenity, this province offers a unique opportunity for those seeking to invest in a realm where aspirations are artfully nurtured, and every vision finds its place amidst the province’s coastal canvas. Join us on an enlightening journey as we navigate Zamboanga Sibugay’s real estate horizon, where each investment is a stroke of progress on this captivating canvas, in a title that encapsulates the essence of this mesmerizing destination.
Demographics
- Age Group with the Highest Population (2015 Census):
- 5 to 9 years old, with 79,437 individuals.
- Age Group with the Lowest Population (2015 Census):
- 80 and over, with 3,960 individuals.
- Population Composition (2015 Census):
- 36.95% of the population, or 233,913 individuals, are aged 14 and below (young dependent population, including infants/babies, children, and young adolescents/teenagers).
- 59.13% of the population, or 374,380 individuals, are aged 15 up to 64 (economically active population and potential workforce members).
- 3.92% of the population, or 24,836 individuals, are part of the old dependent population (senior citizens aged 65 and over).
- Age Dependency Ratios (2015 Census):
- There are 62 youth dependents for every 100 of the working age population.
- There are 7 aged/senior citizens for every 100 of the working population.
- Overall, there are 69 dependents (comprising both young and old-age dependents) for every 100 of the working population.
- Median Age (2015 Census):
- The median age is 21, indicating that half of the entire population of Zamboanga Sibugay are aged less than 21, and the other half are over the age of 21.
| Name | City/ Municipality | Population (2020) | Population (2015) | Annual Population Growth Rate (2015‑2020) | Area (km2) | Density (2020), per km2 | Brgy count |
|---|---|---|---|---|---|---|---|
| Alicia | municipality | 39,456 | 36,013 | 1.94% | 183.08 | 216 | 27 |
| Buug | municipality | 38,425 | 36,634 | 1.01% | 134.06 | 287 | 27 |
| Diplahan | municipality | 32,585 | 32,428 | 0.10% | 255.51 | 128 | 22 |
| Imelda | municipality | 26,020 | 28,018 | -1.55% | 85.12 | 306 | 18 |
| Ipil | municipality, capital | 89,401 | 74,656 | 3.87% | 168.46 | 531 | 28 |
| Kabasalan | municipality | 46,884 | 44,336 | 1.18% | 289.20 | 162 | 29 |
| Mabuhay | municipality | 37,390 | 36,870 | 0.30% | 82.85 | 451 | 18 |
| Malangas | municipality | 32,022 | 33,380 | -0.87% | 235.53 | 136 | 25 |
| Naga | municipality | 41,743 | 38,547 | 1.69% | 246.30 | 169 | 23 |
| Olutanga | municipality | 38,438 | 33,671 | 2.83% | 113.30 | 339 | 19 |
| Payao | municipality | 34,952 | 31,686 | 2.09% | 192.33 | 182 | 29 |
| Roseller Lim | municipality | 43,575 | 43,646 | -0.03% | 300.00 | 145 | 26 |
| Siay | municipality | 40,585 | 41,572 | -0.50% | 313.66 | 129 | 29 |
| Talusan | municipality | 27,873 | 29,969 | -1.51% | 58.16 | 479 | 14 |
| Titay | municipality | 53,994 | 49,673 | 1.77% | 350.44 | 154 | 30 |
| Tungawan | municipality | 46,497 | 42,030 | 2.15% | 473.28 | 98 | 25 |
| Zamboanga Sibugay Total | 669,840 | 633,129 | 1.19% | 3,481.28 | 192 | 389 | |
Economy
| Fiscal Year | Annual Regular Income | Change |
|---|---|---|
| 2009 | 624,111,608.55 | – |
| 2010 | 625,444,134.50 | 0.21% |
| 2011 | 677,258,998.78 | 8.28% |
| 2012 | 652,109,575.87 | -3.71% |
| 2013 | 724,421,365.98 | 11.09% |
| 2014 | 823,695,592.58 | 13.70% |
| 2015 | 973,586,048.33 | 18.20% |
| 2016 | 1,067,450,140.66 | 9.64% |
| End notes:Annual Regular Income = Locally Sourced Revenue + Internal Revenue Allotment (IRA) Current Year + Other Shares from National Tax CollectionLocally Sourced Revenue = Real Property Tax (General Fund) + Tax on Business + Other Taxes + Regulatory Fees + Service/User Charges + Receipts from Economic Enterprises | ||
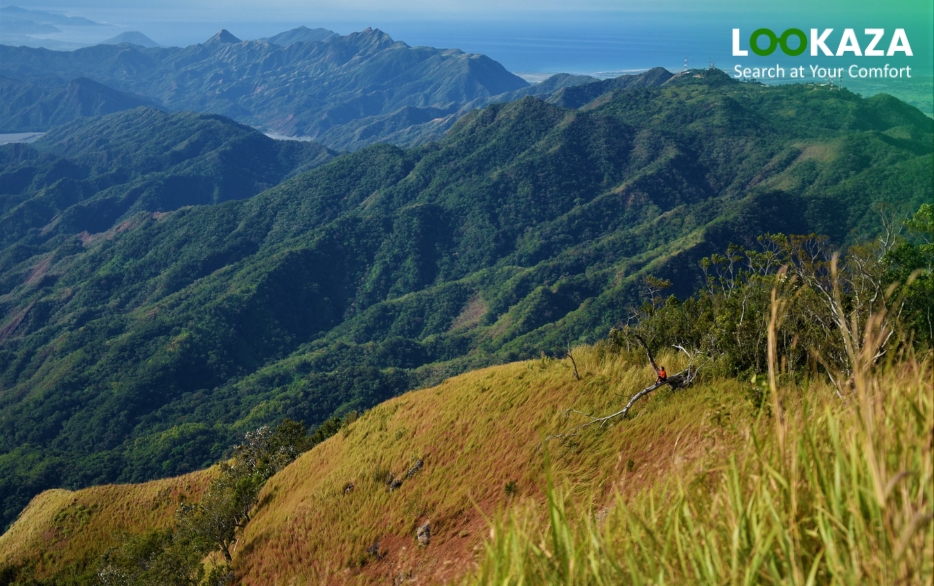
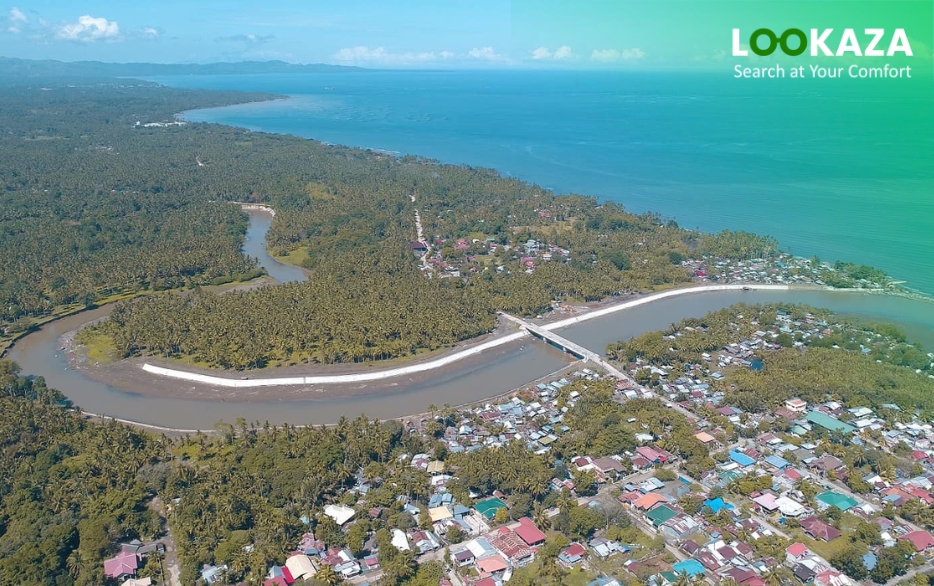
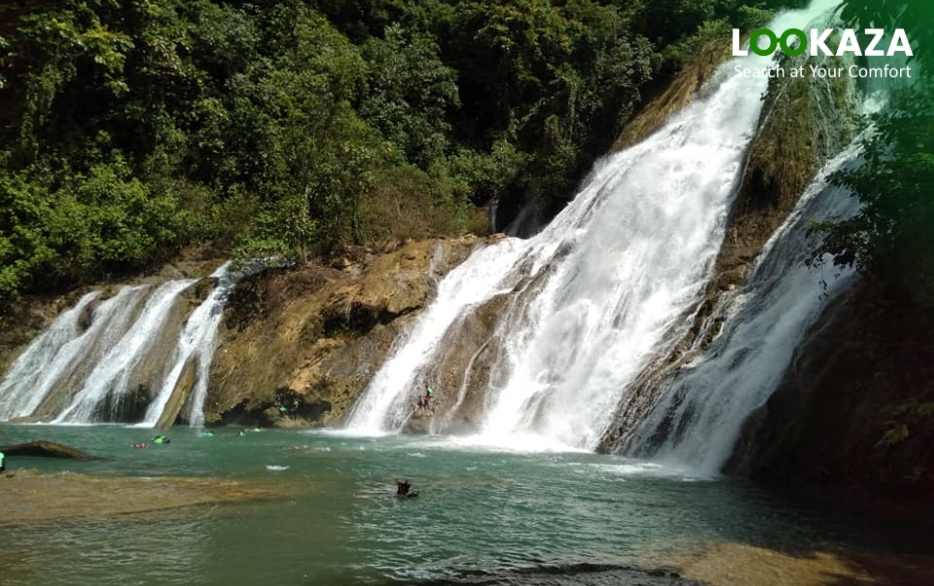
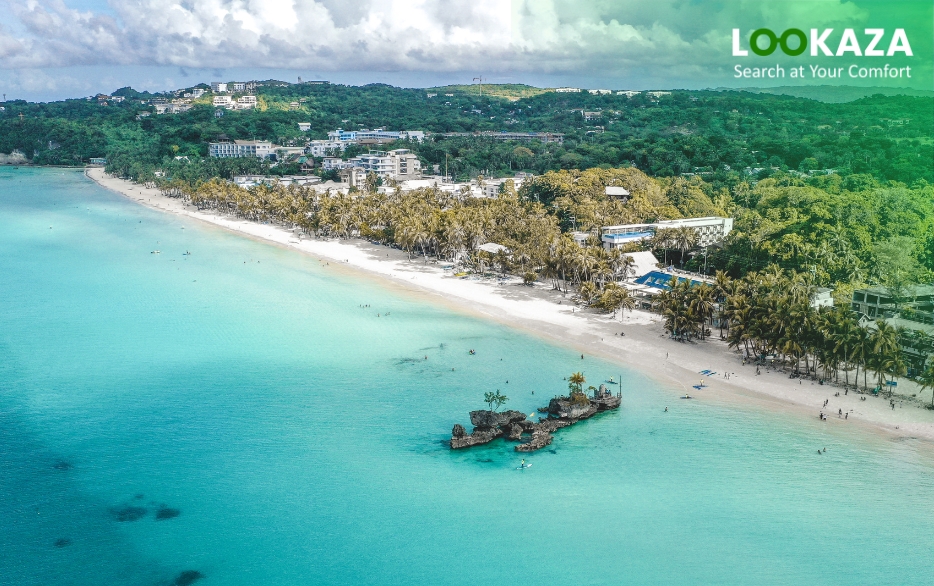
Tourism
Zamboanga Sibugay offers coastal serenity to travelers seeking to explore the Philippines’ unspoiled beauty. Its pristine beaches, hidden coves, and water adventures offer unique attractions for those looking to reconnect with nature.
Visitors to Zamboanga Sibugay can savor tranquil moments on secluded beaches, explore untouched islands, and immerse themselves in water sports. The province’s potential as an eco-tourism destination is a hidden gem for those seeking an authentic and peaceful retreat.